
Every observatory need a meteostation thus here is the induino version!
Features:
- High precision barometer.
- Relative Humidity (HR) reading.
- Dewpoint calculation.
- Far sky temperature using Infrared Thermometer for determining cloud cover.
- Photocell to read sun radiance levels.
- One internal thermometer.
- Two external thermometer.
- Clouldy, dewing, freezing and daylight digital flag.
- Sensor malfunction flags.
- Web Interface with historical data.


SENSORS
Pressure sensor:

We use this breakboard with a BMP085 sensor and Adafruit library and examples. It is a very precise barometer normally include in gadgets to determine altitude from sea level. Also include a thermometer inside that we use to read the internal case temperature. Is a I2C component calibrate at factory. The breadboard include the pull-up resistor for the I2C. Cost about 9$
Relative humidity sensor:
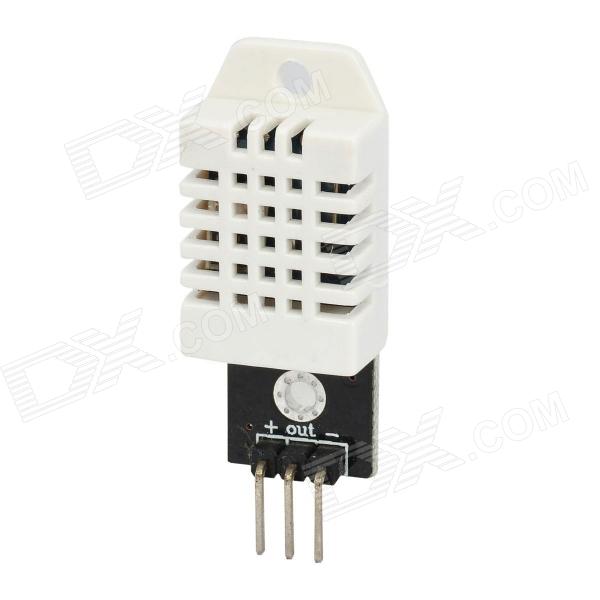
We chose DHT22 sensor that is the cheaper one (humidity sensors are expensive). It use a non standard one wire protocol but it is easy to read the values with this arduino DHT library . Also include a temperature sensor need for its HR calculations but available for direct ambient measurement. I buy this one. Cost about 11$.
Cloud sensor:
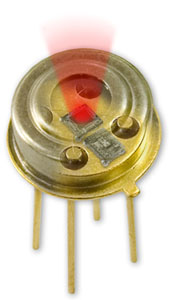
The Melexis MLX90614 chip. Really it is not a cloud sensor. It is a Infra-red thermometer that can be uses for such propose. Measuring the sky temperature and comparing with ambient temperature is a good indicator of how cloudy is the sky. It is connected also to the arduino I2C bus and is read using the code and the information of this great blog. Cost about 11$. You can buy from a general component store such digikey or mouse.
Photocell:

This is a photocell canibalized from a chiness litle toy. I put 10k Ohm resistor between the terminals and connect it to the arduino GND and analog input A0. Voltage readings are proportional to the incident light.
CONNECTIONS
Follow below schematic to connect all together:
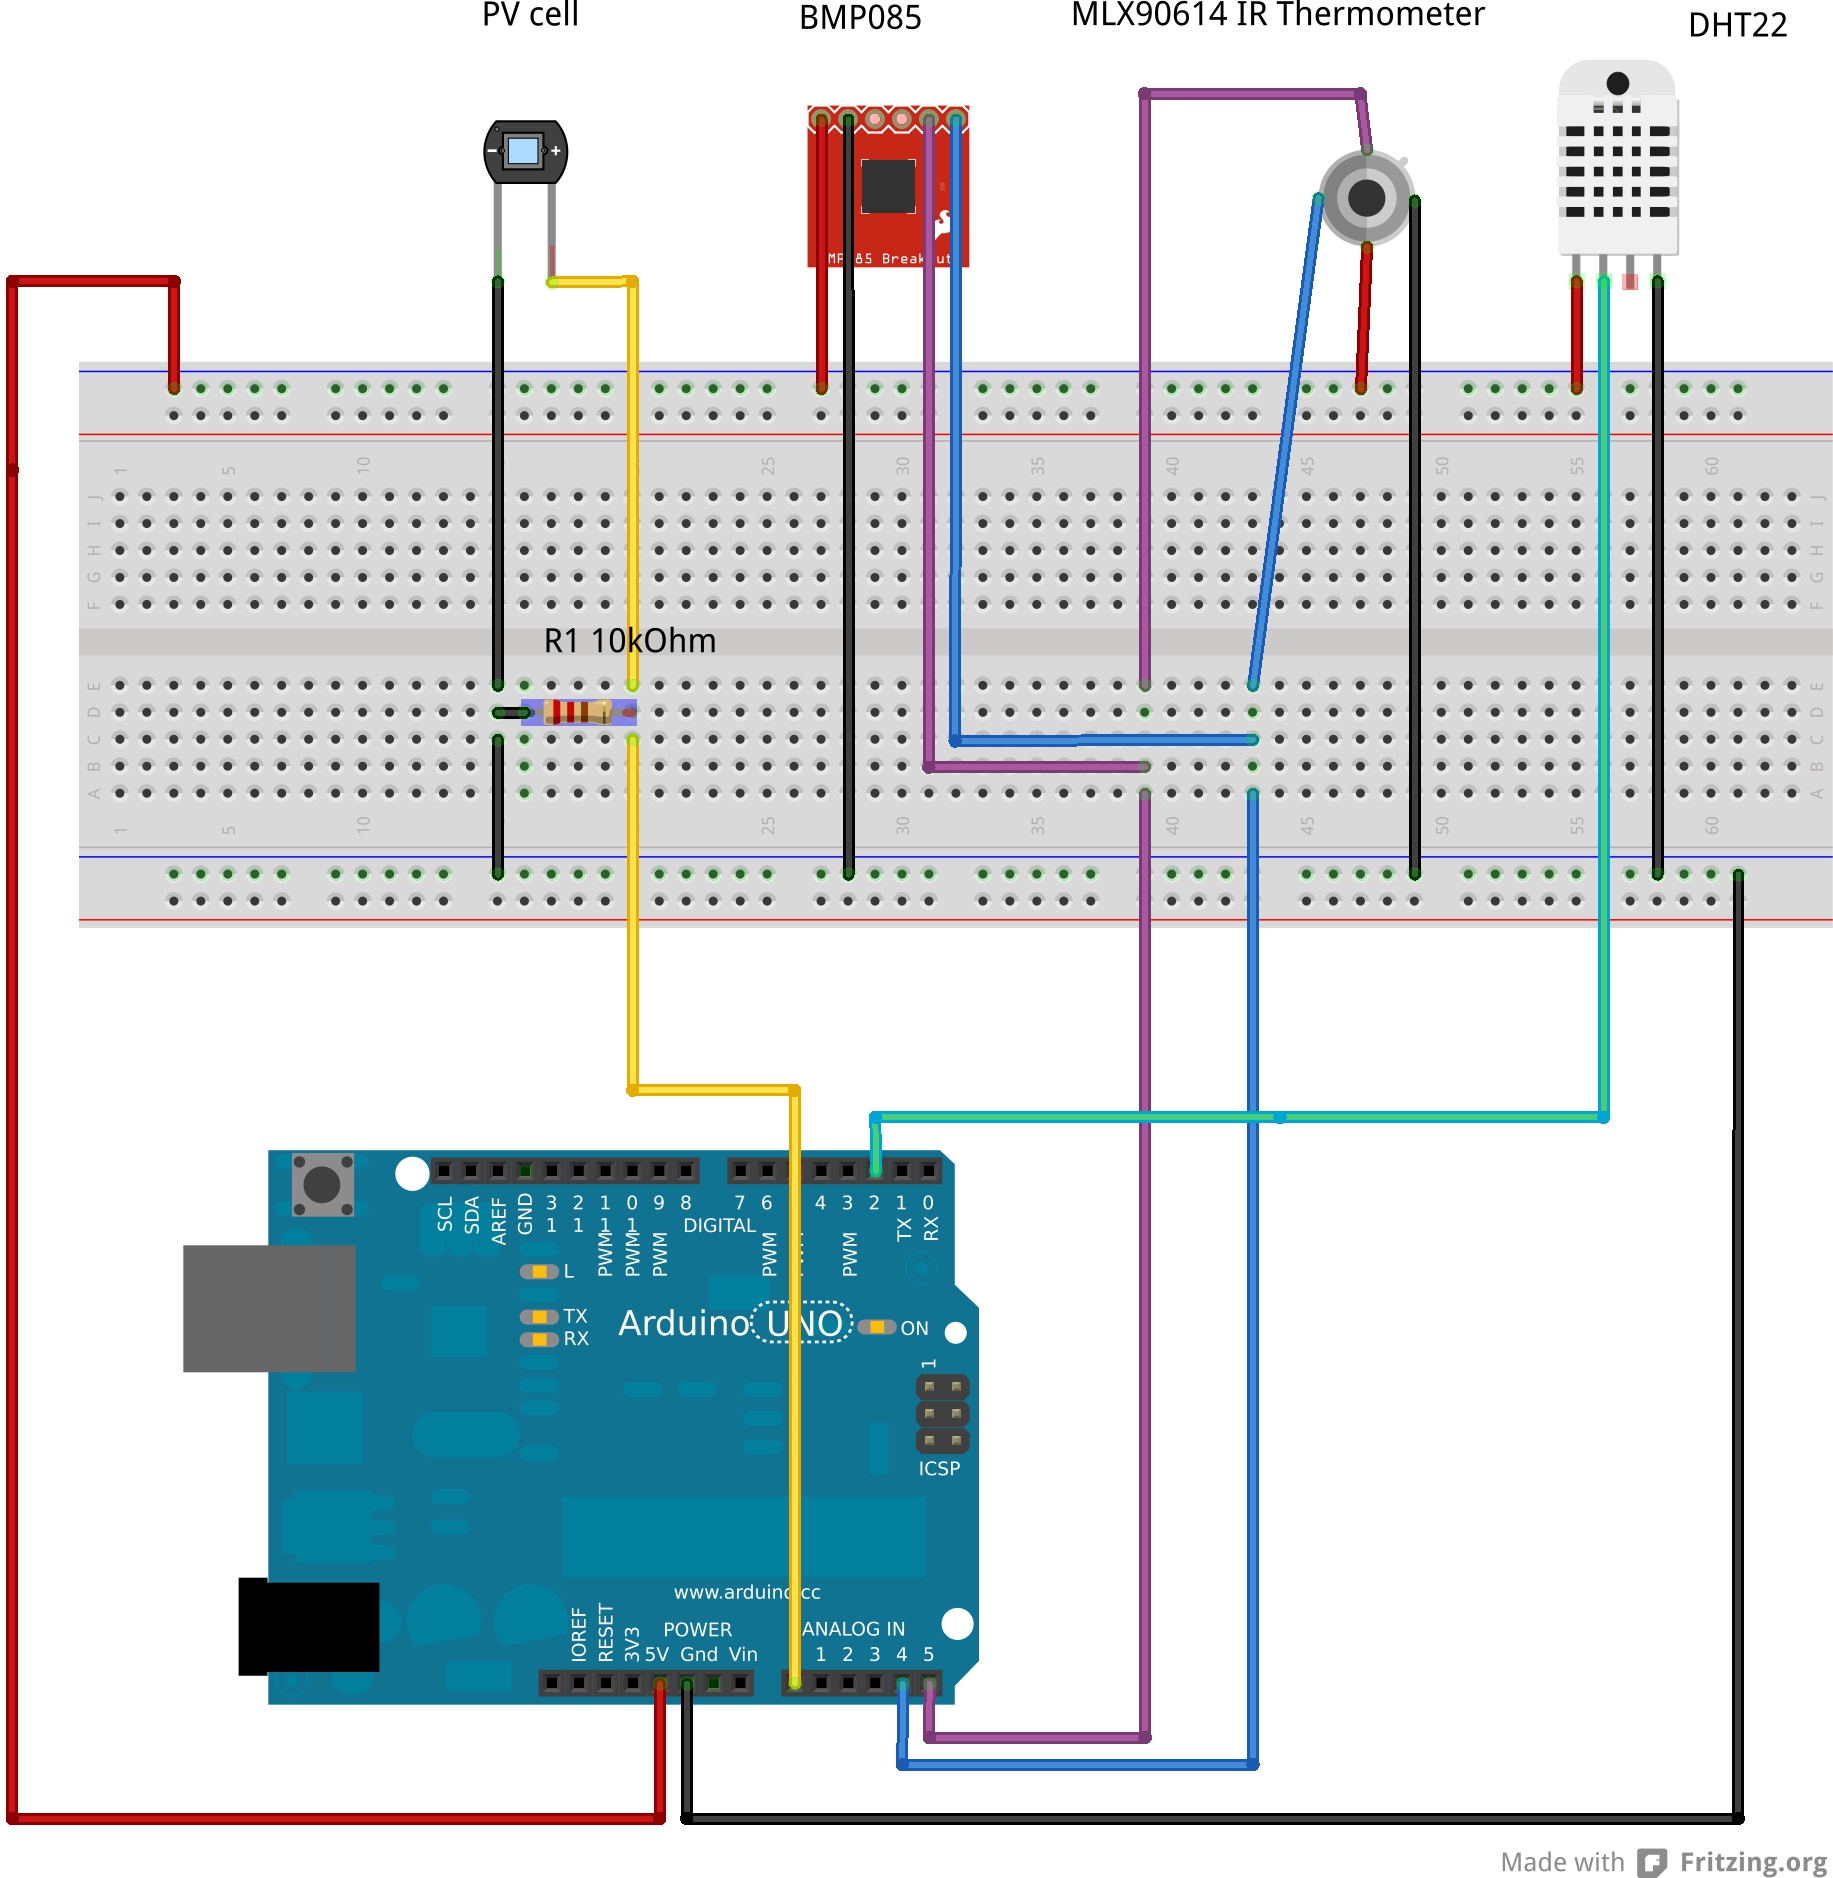
Check everything is OK burning “indi-code/3partie/indi-duino/device/firmware/METEOtest”. Open arduino-ide serial monitor and see if the readings are OK.
Putting in a waterproof box:

COMPILING THE DRIVER
Follow the general instructions.
BURNING THE FIRMWARE
This project uses several non-standard library. To make the things easy all this libraries are bundle with the indiduino firmware. Just mention them to said thanks and recognize intellectual property of the authors:
- http://www.adafruit.com/products/391
- http://bildr.org/2011/02/mlx90614-arduino/
- http://playground.arduino.cc/Main/DHTLib
Burn “indi-code/3partie/indi-duino/device/firmware/meteoINDIDUINO” on your arduino board. Test.
If cloud are not detect properly possible you need to make some adjustments. Edit indiduinoMETE.ino and change correction formula or cloud temperature parameters empirically.
//Cloudy sky is warmer that clear sky. Thus sky temperature meassure by IR sensor//is a good indicator to estimate cloud cover. However IR really meassure the
//temperatura of all the air column above increassing with ambient temperature.
//So it is important include some correction factor:
//From AAG Cloudwatcher formula. Need to improve futher.
//http://www.aagware.eu/aag/cloudwatcher700/WebHelp/index.htm#page=Operational%20Aspects/23-TemperatureFactor-.htm
//Sky temp correction factor. Tsky=Tsky_meassure – Tcorrection
//Formula Tcorrection = (K1 / 100) * (Thr – K2 / 10) + (K3 / 100) * pow((exp (K4 / 1000* Thr)) , (K5 / 100));
#define K1 33
#define K2 0
#define K3 4
#define K4 100
#define K5 100
//Clear sky corrected temperature (temp below means 0% clouds)
#define CLOUD_TEMP_CLEAR -8
//Totally cover sky corrected temperature (temp above means 100% clouds)
#define CLOUD_TEMP_OVERCAST 0
//Activation treshold for cloudFlag (%)
#define CLOUD_FLAG_PERCENT 30
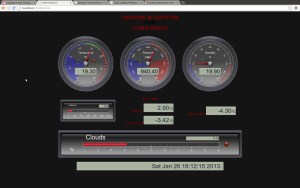
WEB INTERFACE

26 October, 2013 at 15:26
I was wondering if you could tell me what the voltage range of the photo cell is. Also how do you have any images of how you made the IT water tight?
26 November, 2014 at 8:39
Will this http://www.adafruit.com/products/161 fit instead of canibalized photocell? 🙂
26 November, 2014 at 8:43
Or this one http://www.adafruit.com/products/1384? (but if I understand it right in case of this one will be necessary to make some changes in the code)
15 January, 2015 at 23:59
Great idea! I’m working on my own setup right now. Is there a reason why you didn’t use an Arduino Nano?
16 October, 2015 at 10:58
Hello
I built the meteo station following the instructions and it works very well! Really a good job, with the interface included. So, to start with, thank you for having shared this.
Second: at present, I just have a few remaining issues to be tuned, and you can probably help:
(1) when I look at the Main web page with the 3 round gauges, all gauges appear with the arrow pointing vertically up, and with a “NaN” in place of a regular value. The other items on the page display correct numbers, and the “Graphs” page too. Only the gauges seem not to work. Also, when I refresh the page, correct values appear briefly but then they are immediately replaced by “NaN”. Any clues?
(2) The “Advanced” page is empty.
(3) sounding.py does not find the tidy module. I installed pytidylib – is this not the right one to have?
Any clues?
Best regards
Paolo
21 October, 2015 at 9:58
Hi Paolo,
Thanks for your good words.
Regarding your issues:
(1) Please check if the file CHART/RTvalues.json has correct values. Also check all other *.json files in this directory. Check also that all the updater daemos are running with “ps ax”:
meteoRRD_updater.py
meteoRRD_graph.py
sounding.py
meteoRRD_MaxMinAvg.py
(2) Advance page is for sounding information and eumesat imagen. Please check that all related vars in meteoconfig.py file are set .
(3) to be truely I dont remember what tidy lib I ussed. Please try installing uTidylib
Please contact again if you have futher problems.
Nacho
15 February, 2016 at 17:57
Hi, I am looking to use the meteoStaion at star parties to tell me if the sky conditions have cleared. What modifications do you suggest to give and audio signal when the sky has cleared.
Thanks
27 December, 2017 at 11:42
Hello,
good job. I have it built and functional at home.
I have a problem with font readability in graphs. I have all completed and tested on Ubuntu Mate and raspberry Pi 3. Everything was readable.
I finished the final solution on Raspberry Pi Zero W and Raspbian Stretch and it’s poorly readable.
Bad font – http://www.indilib.org/media/kunena/attachments/3015/Bad.png
Good font – http://www.indilib.org/media/kunena/attachments/3015/nice.png
Do not know what the problem is?
Thank you.
Thomas
27 December, 2017 at 12:18
Hi,
MeteoStations graphs are base on rrdtool and python-rrdtool so your problem looks relate to some missing fonts on Raspberry Pi Zero W and Raspbian Stretch but really I don’t know…
May be relate on the rrdtool version for this platforms. rrdtool move to pango … see https://github.com/oetiker/rrdtool-1.x/issues/256
Nacho